plotsegreg() plots the fitted lines resulting from a segmented regression model.
Usage
plotsegreg(x, scores, ...)

# S3 method for class 'regions_pco'
plotsegreg(
  x,
  scores,
  modelsupport = NULL,
  criterion = "aic",
  model = 1,
  bps = NULL,
  cont = TRUE,
  ...
)

# S3 method for class 'regions_sim'
plotsegreg(
  x,
  scores,
  modelsupport = NULL,
  criterion = "aic",
  model = 1,
  bps = NULL,
  cont = TRUE,
  ...
)

# S3 method for class 'regions_results_single'
plotsegreg(x, scores, ...)
Arguments
- x
a
regions_pcoobject, the output of a call tosvdPCO(), or aregions_results_singleobject, the output of a call tocalcmodel().- scores
numeric; the indices of the PC scores for which the fitted lines should be plotted.- ...
ignored.
- modelsupport
a
regions_modelsupportobject, the output of a call tomodelsupport(). Whenxis aregions_pcoobject, eithermodelsupport,criterion, andmodelmust be supplied orbpsandcontmust be supplied. See Details.- criterion
string; the criterion to use to select the best model for which breakpoints are to be displayed when
modelsupportis specified. Ignored otherwise. Allowable options include"aic"to use the AICc and"bic"to use the BIC. Abbreviations allowed. Default is"aic". Whenxis aregions_pcoobject, eithermodelsupport,criterion, andmodelmust be supplied orbpsandcontmust be supplied. See Details.- model
numeric; for which model among the best as determined bycriterionshould fitted lines be plotted. 1 is the best model, 2 the second best, etc. Default is 1. Whenxis aregions_pcoobject, eithermodelsupport,criterion, andmodelmust be supplied orbpsandcontmust be supplied. See Details.- bps
numeric; a vector of breakpoints for which model fitted lines should be plotted. Whenxis aregions_pcoobject, eithermodelsupport,criterion, andmodelmust be supplied orbpsandcontmust be supplied. See Details.- cont
logical; whether to fit a model that is continuous (TRUE) or discontinuous (FALSE) at the breakpoints supplied tobps. Default isTRUE. Whenxis aregions_pcoobject, eithermodelsupport,criterion, andmodelmust be supplied orbpsandcontmust be supplied. See Details.
Details
plotsegreg() operates on a single model identified by breakpoints and whether the model is continuous or not. When x is a regions_pco object, the model is selected either as the best model in the supplied modelsupport object (where "best" is determined by the arguments to criterion and model) or as specified by the user using the arguments to bps and cont. When x is a regions_results_single object, the breakpoints and model form are determined based on the supplied object.
plot() is an alias for plotsegreg() for regions_results_single objects.
See also
modelsupport() for assessing model support using information criteria; calcmodel() for fitting a single segmented regression model; modelperf() for computing fit statistics for a single segmented regression model.
Examples
data("alligator")
alligator_data <- process_measurements(alligator,
pos = "Vertebra")
# Compute PCOs
alligator_PCO <- svdPCO(alligator_data)
# Evaluate model performance (R2) given supplied
# breakpoints for a continuous model
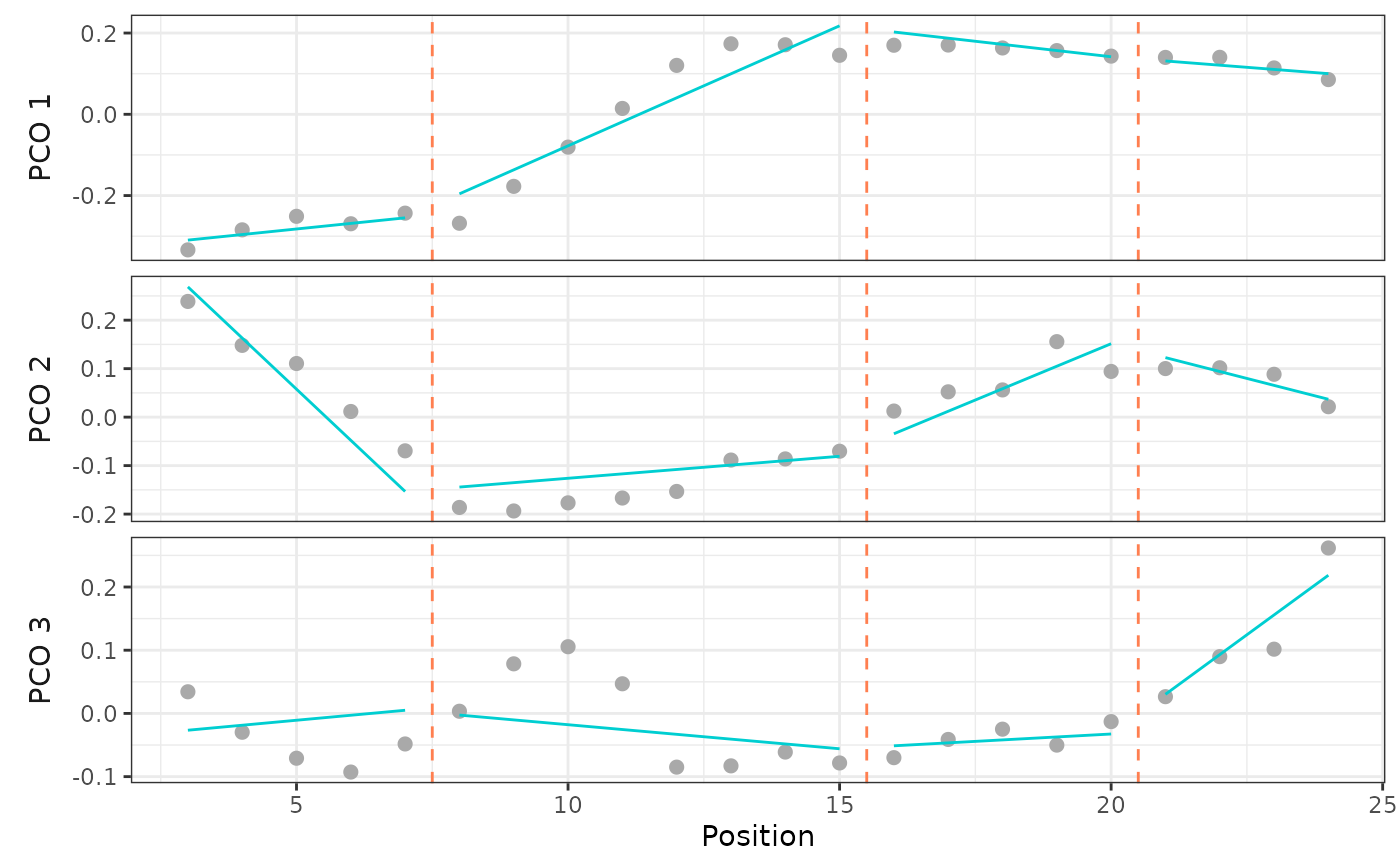
modelperf(alligator_PCO, scores = 1:3,
bps = c(7, 15, 20), cont = TRUE)
#> Breakpoints: 7, 15, 20
#>
#> - Univariate:
#> R² Adj. R²
#> PCO.1 0.963 0.954
#> PCO.2 0.888 0.862
#> PCO.3 0.636 0.550
#>
#> - Multivariate:
#> R² Adj. R²
#> 0.902 0.879
plotsegreg(alligator_PCO, scores = 1:3,
bps = c(7, 15, 20), cont = TRUE)
 ## See also `?calcmodel` for use with a single model
# Fit segmented regression models for 1 to 7 regions
# using PCOs 1 to 4 and a continuous model with a
# non-exhaustive search
regionresults <- calcregions(alligator_PCO,
scores = 1:4,
noregions = 7,
minvert = 3,
cont = TRUE,
exhaus = FALSE,
verbose = FALSE)
regionresults
#> A `regions_results` object
#> - number of PCOs used: 4
#> - number of regions: 1, 2, 3, 4, 5, 6, 7
#> - model type: continuous
#> - min vertebrae per region: 3
#> - total models saved: 112
#> Use `summary()` to examine summaries of the fitting process.
# For each number of regions, identify best
# model based on minimizing RSS
bestresults <- modelselect(regionresults)
# Evaluate support for each model and rank
supp <- modelsupport(bestresults)
# Evaluate model performance (R2) for best model
# as chosen by BIC
modelperf(alligator_PCO, scores = 1:4,
modelsupport = supp,
criterion = "bic", model = 1)
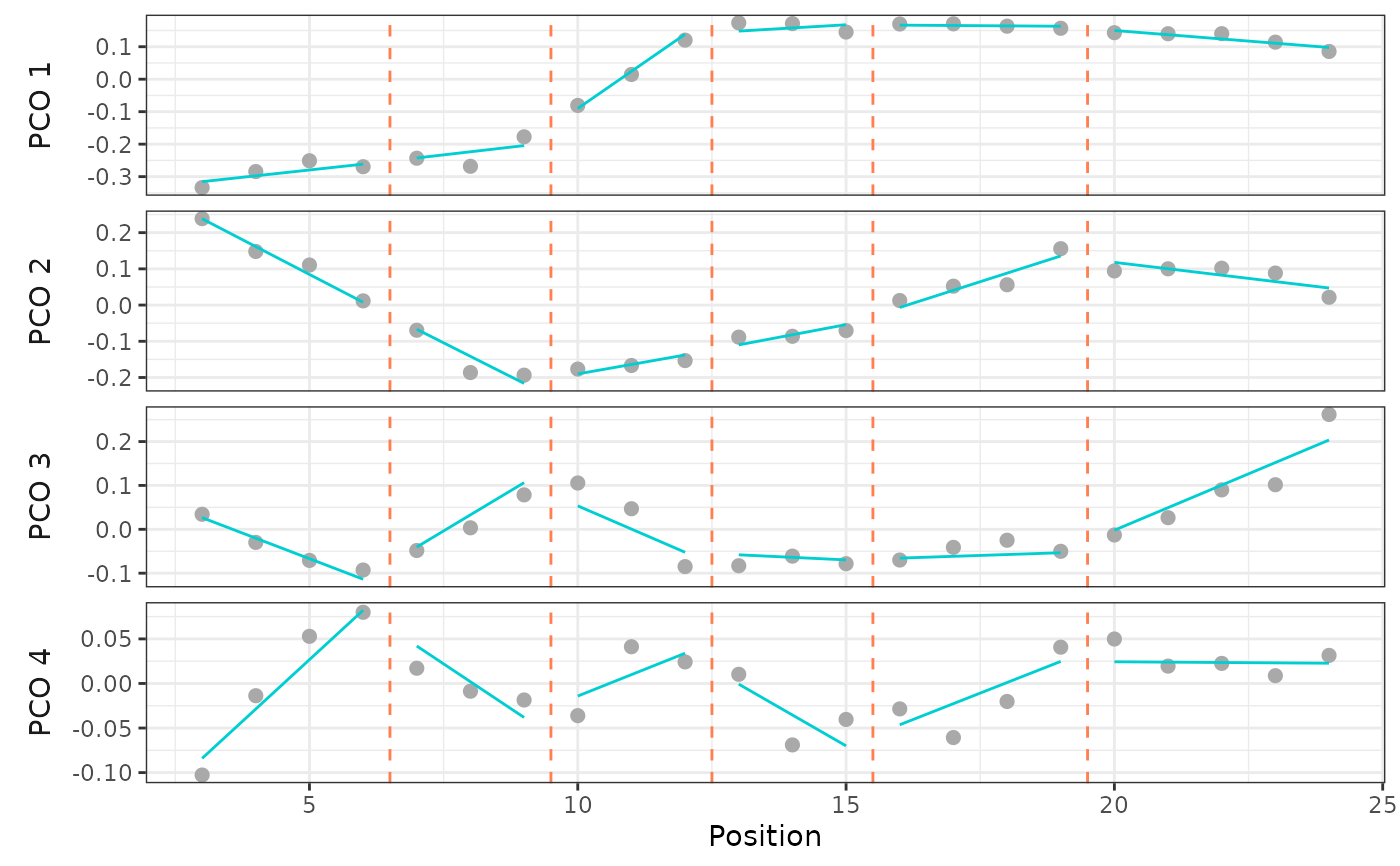
#> Breakpoints: 6, 9, 12, 15, 19
#>
#> - Univariate:
#> R² Adj. R²
#> PCO.1 0.992 0.988
#> PCO.2 0.975 0.964
#> PCO.3 0.892 0.849
#> PCO.4 0.772 0.681
#>
#> - Multivariate:
#> R² Adj. R²
#> 0.968 0.956
# Plot that model for the first PCO score
plotsegreg(alligator_PCO, scores = 1:4,
modelsupport = supp,
criterion = "bic", model = 1)
## See also `?calcmodel` for use with a single model
# Fit segmented regression models for 1 to 7 regions
# using PCOs 1 to 4 and a continuous model with a
# non-exhaustive search
regionresults <- calcregions(alligator_PCO,
scores = 1:4,
noregions = 7,
minvert = 3,
cont = TRUE,
exhaus = FALSE,
verbose = FALSE)
regionresults
#> A `regions_results` object
#> - number of PCOs used: 4
#> - number of regions: 1, 2, 3, 4, 5, 6, 7
#> - model type: continuous
#> - min vertebrae per region: 3
#> - total models saved: 112
#> Use `summary()` to examine summaries of the fitting process.
# For each number of regions, identify best
# model based on minimizing RSS
bestresults <- modelselect(regionresults)
# Evaluate support for each model and rank
supp <- modelsupport(bestresults)
# Evaluate model performance (R2) for best model
# as chosen by BIC
modelperf(alligator_PCO, scores = 1:4,
modelsupport = supp,
criterion = "bic", model = 1)
#> Breakpoints: 6, 9, 12, 15, 19
#>
#> - Univariate:
#> R² Adj. R²
#> PCO.1 0.992 0.988
#> PCO.2 0.975 0.964
#> PCO.3 0.892 0.849
#> PCO.4 0.772 0.681
#>
#> - Multivariate:
#> R² Adj. R²
#> 0.968 0.956
# Plot that model for the first PCO score
plotsegreg(alligator_PCO, scores = 1:4,
modelsupport = supp,
criterion = "bic", model = 1)
 ## See `?simregions` for use with simulated data